


J-Doc
-
Posts
3,426 -
Joined
-
Last visited
-
Days Won
1
Content Type
Profiles
Forums
Blogs
Events
Articles
Video Feed
Gallery
Everything posted by J-Doc
-
Same here! I wish I had some sonar training years ago so I would have known what I was looking at. Its not a matter of "how to use the sonar" more than how to READ the sonar. I myself and others tweak settings often based on conditions but knowing how to read it will allow you to know how and when to adjust the settings to get you what you need. Fish or rock?? Man that's a big question and I can't tell you how many fish I passed up not knowing they were fish or thinking it was catfish only. I'm going to kick start this question within the main thread so stay tuned. Much to learn on this question. I was fortunate enough to have a guide show me the way on this particular question.
-
No problem. I figure there are lurkers and there are folks that don't get out of their home lake forum (including me) so I'm simply getting the word out. Check back on the main thread in the General Discussion forum (link above in my initial post) or follow the thread by clicking "follow this topic" on the upper right and I'm sure we will get more information on their. I know I'll be posting more screenshots in the coming months.
-
Or too busy repairing outboards......... whichever comes first. LOL! Good tip Jerry. I know some people use it and some don't. For years, I've stayed within my little home lake forum only and don't branch out much. I figured there are others who might be that way as well. You never know and I'd hate for someone to miss out.
-
Hi all. If you're like me, you may only subscribe to your lake's forum so you may not have seen this new thread below. Between all of the lakes on this forum, I know there are some very experienced anglers who understand their sonar and how to interpret the data they see. There are also a lot of people who do not know or understand how to interpret what they see on their sonar (fish finder). Swing by and take a look at this thread and participate if you like. Post some screenshots, post your opinions on what others have posted in an effort to teach others how to read a graph. Thanks!
-

Fish Finder Training – Screenshots & Interpretations
J-Doc replied to J-Doc's topic in General Angling Discussion
I offset mine to measure depth from the keel at the stern. So if my graph says 1ft when I'm loading the boat, I know it's got 1ft between the keel and the ramp. Make sense? As for the trolling motor, I try to use keel depth as well so if I look at the front graph and the back graph, I hope they are within less than 1ft of each other but it doesn't matter up front as much as the keel I think. So if I'm on plane and running, and my graph says 10ft, I get a bit cautious for underwater stumps and such. -
Fish Finder Training – Screenshots & Interpretations
J-Doc replied to J-Doc's topic in General Angling Discussion
Here's a screenshot of an old submerged bridge or at least what's left of the pilings and the gap of the creekbed. This is just off of the marina at Prairie Creek on Beaver Lake. F&F thinks this is a pretty good shot of a thermocline setting up. I think he's correct. It's a bit thick but it's settling in with all of this hot weather we've been getting the last week or so. This shot was taken July 6th before the fireworks show at Prairie Creek.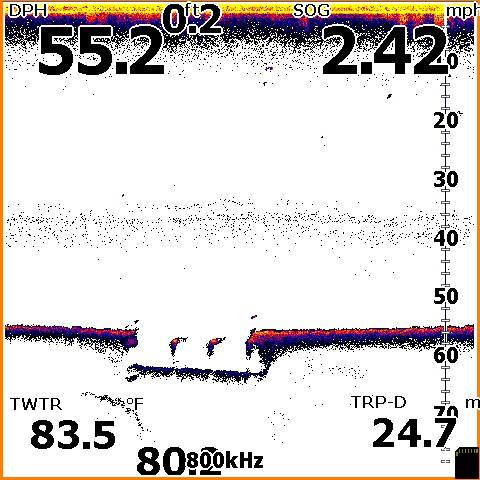
-
Fish Finder Training – Screenshots & Interpretations
J-Doc replied to J-Doc's topic in General Angling Discussion
You are probably right Nathan. Good find! See......I'm still new to this game as well so I hope to learn a lot myself. I do hope this thread turns into a very helpful resource. I think there is a lot of collective knowledge within this forum alone and if we help each other, I think we can all learn some things. One can spend hours browsing Youtube and still not see it applied to a real-life experience. If someone can take a photo of their graph, post it here and get multiple opinions, I would think it would be not only less time spent on their part but better real-life information applied to them specifically. So..... Share your screenshots/photos of your graph. I know of some particular forum members that are willing to help and have not chimed in yet but they will be. -
Fish Finder Training – Screenshots & Interpretations
J-Doc replied to J-Doc's topic in General Angling Discussion
Totally agree. I found that when I switch from 455kHz to 800kHz on my unit that I have to completely change the noise rejection, surface clarity, and contrast. Unfortunately, my unit uses Generation 1 structure scan so I do not have sensitivity settings (UGH!!!). I wish I did as it could make much better images. So thermocline...... What is it? Google it. That's an easy answer. It's the separation of water temperature. Think water and oild and how oil floats on top of water. Colder water separates from warmer water and there is a noticeable temperature change where this occurs. That's the thermocline. My unit shows a series of dashes like this..../ / / / / / / / / / and someone told me that was "noise". I disagree as I feel its picking up the thermocline change because my traditional sonar picks up similar echos and shows a thermocline on that graph as well. -
Fish Finder Training – Screenshots & Interpretations
J-Doc replied to J-Doc's topic in General Angling Discussion
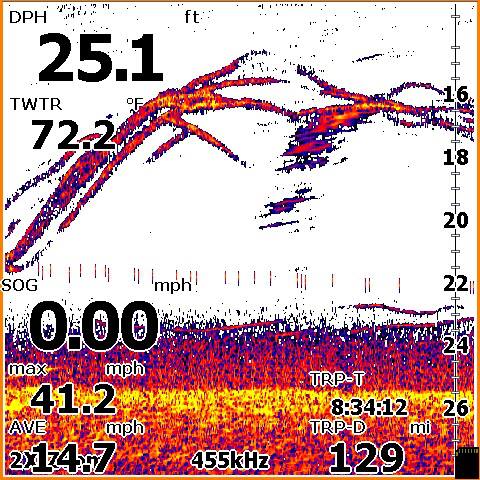
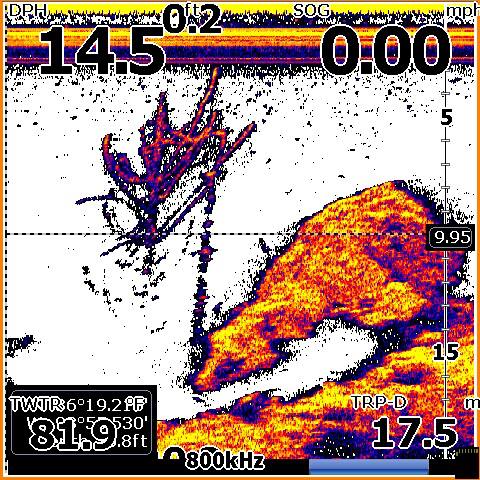
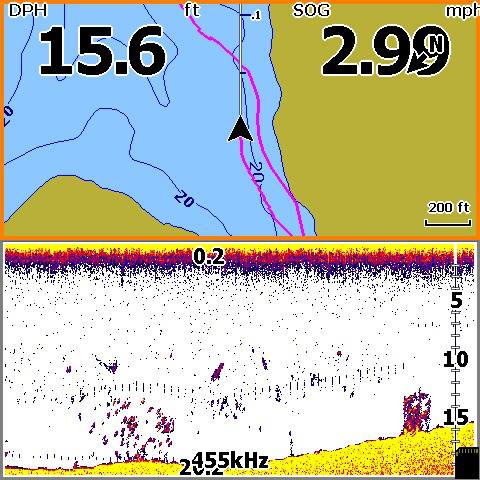
Here is a brief collection of some sonar photos. I've made it a habit to start collecting interesting sonar images because its very interesting to me. Plus I can go back and look at the image later in more detail and see if I missed something or get someone else's opinion on what I found. I've learned a lot from that alone. So this first image is a classic bait ball using my new Elite 5dsi with structure scan. This is using 455kHz which is the lowest frequency this unit has so it's casting a very broad oblong cone shape as described above and shown by nathanhooper (nice find by the way Nathan!). This image is showing a school of fish next to bait. The bait is the smaller "dots" grouped tightly together and the larger dots are probably white bass. Why white bass? Simply because of the time of year and the particular cove I was in at the time was known as a staging area for whites as they leave the river arm after spawning. This is a good educational image here. This image is showing a submerged tree right? Look closely at all of the multi-colored short arches/dots. That's a mess of crappie on a tree with a few larger fish near the bottom. Possibly walleye or bass? Here is a nice school of stripers and hybrids just in front of the Hwy 12 bridge on Beaver Lake. This is using traditional sonar as it gave much better "arches" than my structure scan unit. I have both units at the helm for side-by-side comparison/usage. I trolled over these rascals 5-6 times and only snagged one because they were deeper than my bait would run. They sat in this spot for hours just floating in open water (gee.........what does that tell you?) This image shows a bait school being attacked by larger fish. Probably Kentucky bass or white bass. Notice the long sweeping arch?? That's because the sonar recorded the fish at a starting depth and up and then as the fish came back down before it was not within the transducer's sounding cone (again, see sonar basics above if you don't know what the cone-shape is) So do you understand why the images show long sweeping arches now? I've seen this many times and had no clue what I was looking at. I knew it had to be a fish somehow but just didn't "get it". A little explanation makes things so much clearer doesn't it? :-) Here is a tricky image. I was using 800kHz at the time trying to get some really cool images of cedar trees. The area I was in had very large boulders mixed with cedar trees. The tree is not "floating"....it's because the cone shape is so narrow that it only picked up a portion of the tree. Does that make sense? Also, the higher frequency usage of 800kHz over 455kHz gave me a crisper image of the rock and cedar tree. It's showing an outer algae layer on the tree itself. Here's another image where I was trolling for walleye/smallmouth. I found a stump where fish were relating just past the stump. Notice structure scan doesn't show "arches" like traditional sonar. This is what I mentioned in the 1st initial post of why traditional arches differ from structure/down imaging. I can still clearly see these are fish and actively feeding.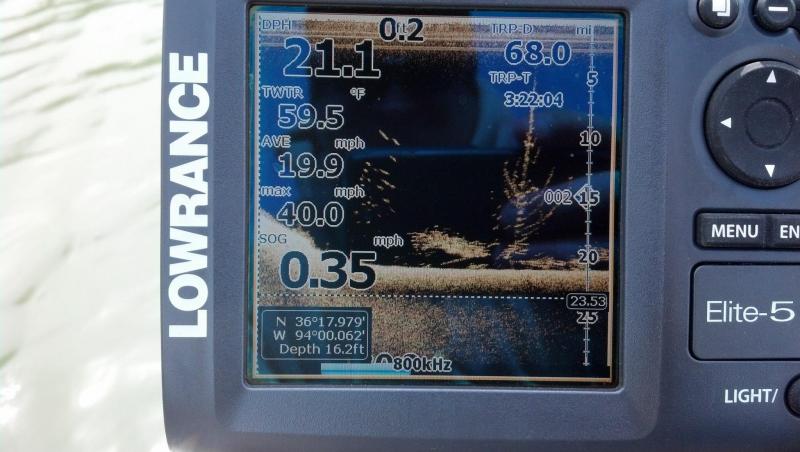

-
Fish Finder Training – Screenshots & Interpretations
J-Doc replied to J-Doc's topic in General Angling Discussion
Great info! Keep it coming! -
Fish Finder Training – Screenshots & Interpretations
J-Doc replied to J-Doc's topic in General Angling Discussion
Here is a thread I borrowed from the Beaver Lake forum. It has some good information and examples with screenshots and interpretations. This is the kind of stuff I'd ike to see gather here in this thread. Actual user photos and users asking for opinions on "what's this?" and getting feedback from other users. -
Gents..... here is a thread I started. If you have screenshots you would like to share and teach or get an interpretation, please post them in the thread below so we can get a "catalogue" of education going. There's a ton of knowledge on this form and I think everyone can learn something.
-
Fish Finder Training – Screenshots & Interpretations
J-Doc replied to J-Doc's topic in General Angling Discussion
Now, post your screenshots or take some photos of your sonar (fish finder) and give us some real-world examples where some experienced anglers can offer their “interpretation” and feedback on what they feel you are seeing. I will post some of my own myself for examples when I get a chance. -
SONAR INTERPRETATION - HOW TO READ MY SONAR (FISH FINDER) AND UNDERSTAND WHAT I’M LOOKING AT I'm starting this thread in hopes that it will become a "sticky" at the top of this forum. I hope this thread serves the novice sonar user and the experienced sonar user as well. First a few questions: How many of us have a fish finder? (I'm guessing 90% of us do) How many use the "fish symbols" because without that, you just don't know what you're looking at and don't have enough confidence in your graph to find fish without it? Do you turn the sensitivity down so much that it will only show "big fish" or big solid objects? Do you know what you're looking at??? (hey, I have to ask) :-) Well....... This is where I hope the "experienced" angler can teach the "inexperienced" sonar user. Where the super-sharp guys that have the really expensive equipment and vast experience can teach some of the common weekend anglers that may only have the $100 Lowrance Cuda, the $70 Humminbird, or some older fish finder their buddy gave them that’s so old, you can’t even find it on the internet. If it will show fish arches, then you can learn something here. What am I seeing on my graph? Is that a bass or is that a catfish on the bottom? Or is that a group of rocks? If you have a $2,000-$3,000 Lowrance or Humminbird unit and feel you need to learn more about sonar interpretation, this is what I hope will be the thread for you as well to cover a broad range. The things I have learned in just the last 2yrs have helped me tremendously and it's taken scratching and clawing to get the information. Why? Because I didn’t have someone to simply take a trip and show me advanced knowledge of what to look at and how to interpret it. I'm hoping this thread will "balloon" into something big and useful for all anglers. I believe others should teach and share the knowledge in order to pass it on to perpetuate the sport. Not, give away secrets in fear that they will have stiffer competition in tournaments because.........if it were easy it would be called "catching" and not "fishing". Am I right? :-) Here are a few highlights as this subject is very broad and there is already a lot of info available on the internet) FOR THE NOVICE - HOW TO READ SONAR: (If this is not you, skip forward to the next level) First….. This needs to be broken down into categories: 1) Basic sonar understanding 2) Advanced sonar 3) Drop-shot presentation 4) Side Imaging 5) 360-degree imaging (I’m not covering much here as I think it’s a gimmick personally until the technology gets better) BASIC SONAR UNDERSTANDING Can't read a lot? Here is a great video http://youtu.be/KTacpPjjWiU What is a cone angle? The cone angle is how your transducer sends out a signal. The transducer sends a hi-frequency ticking sound in the shape of a cone. The signal bounces back to the transducer as it hits an object and since a fish is arch shaped in nature, it creates an arch on the graph. Why does it matter what frequency I use? What’s a frequency? (haha) Some units use 200kHz and some use up to 400 or even 800kHz. This hi-frequency, the more detailed the image presented on your graph but it also narrows the cone shape so you will cover less area. For users with structure scan or “down scan imaging”, your transducer emits in an oblong shape which is basically a “squeezed cone shape”. Look up your manual for more info on your particular unit. What’s ping speed? Ping speed is the rate of speed the transducer sends a signal. The faster the signal, the more accurate the information which is great for dropshoting (well I think so anyway) What is chart speed? Chart speed is just that, how fast the information is displayed on a chart What is Sensitivity? Should it be on auto? (typically yes) Most know this is how sensitive the unit picks up smaller signals What is noise rejection? Typically, this is rejecting electrical noise and mixed signals from aerators, trolling motors, etc. It can decrease the sensitivity I personally turn noise rejection off when I use 800kHz on my DSI unit NOW…..what is a chart? When you’re watching your fish finder, you see arches or “fish symbols” scroll across. What you’re looking at is a caption of a moment in time. Ever see a polygraph on TV? Or heart monitor on a movie when the patient flat lines and the heart stops? This is essentially what you’re seeing with your fish finder. If your unit is equipped with it, you will have lines appearing on the right hand side. What you’re seeing there is “live feed”. This is essentially the old “flasher sonar” that your grandpa or dad used back in the day. It’s vertical now instead of 360 degrees. Any of this making sense? If not, go back and re-read. J Think “chart readout” or watching a scroll of paper feeding out of a machine while it prints lines on it. That’s essentially what your graph is showing in both traditional sonar and the new structure scan or down scan. That’s the basics. Pretty easy huh? It took me forever to understand the “heart monitor” or “polygraph” thing. I had to have a guide show me on his fancy sonar while he taught me how to dropshot before I “got it”. Once I “got it”, the doors started opening. ADVANCED SONAR (This is where I need help from other forum members) So if you have structure scan or down imaging or even side scan, you probably already know what it is and how it works. Or at least the basics. When looking at structure/down scan imaging, you’re seeing a higher frequency signal sent to your unit which gives a higher definition reading. Why can’t I see fish arches with structure scan? Well, since it’s a higher frequency the signal is not as “muddy” as it is with traditional sonar so the arches are smaller. Think of it this way. When you show a split screen or when you switch from a lower frequency to a higher frequency, you will see trees show up sharper and crisper. To me, 800kHz is great for showing sunken school buses online and sunken bridges. (hahaha). These show hi-definition of the bottom structure but not as much on fish arches. Its best to get a good reading on what you’re seeing for both bottom structure, hard pan or soft, depth, brush piles, rocks, etc. as well as fish arches. That’s why units that show both traditional sonar and structure scan on split screens is the best way to learn between the two. DROPSHOT PRESENTATION Ever wanted to learn how to do this beter? I know I did. I had a local guide take me out one day and gave me a quick lesson on what I was seeing underwater and within 2mins, I “got it”. I hope this explanation helps you “get it” as well. Remember when I mentioned the bars on the right side of your graph being a “live feed”?? If not, go back up to “Now, what is a chart” section and read that again. That’s essentially dropshot presentation. You drop a bait or a jig, or even live bait below your transducer and watch the object fall “live” by watching the little lines on the right side. You’ll see your bait dropping and then you’ll see a diagonal line on your graph. THAT is the history or the readout of where your bait was as it was falling. It doesn’t mean your bait fell at an angle, it’s just a readout of the “cone angle”. (re-read cone angle above). In order to drop shot or see your bait of any kind on the graph, it MUST be within the cone angle. I suggest using the lowest frequency possible to create a “WIDE” cone angle. The deeper the water, the larger your cone will be. If you’re in 10ft, your cone diameter will be much smaller in size than it will be in 30ft. SIDE IMAGING Here’s a good link that explains what this is and how to use it. http://youtu.be/yNucS1bniIw 360 DEGREE IMAGING Ever see a radar tower on a ship or at an airport? Ever see a radar scope on a movie where you see the plans or little “blips” on the scope in the movie TOP GUN where you can see the images projected on the scope representing the planes? Well……….that’s the same theory of 360 imaging. A transducer is lowered below the boat and scans the area up to a particular distance and projects and image. Problem is, it’s not as advanced as side imaging and structure scan so the images are a bit “blury”. If you understand what you’re looking at and how to use it, it can be a “gamechanger” as KVD says. Well, that’s a start of a very broad subject with a “simplistic” view or explanation.
-
I should clarify...... The info above is from what I've been told. I've only night fished under a light once so I'm no expert by any means but the advise above is sound and works. I know some folks that have been using this and it's working.
-
Live shad under a light in about 20-25ft of water with bait rigged split shot about 2ft above hook. Nose hook bait and allow to sink to bottom. Slowly reel bait off the bottom keeping contact on the line. Use light gear and light line about 4-6lb fluorocarbon. Be as quiet as possible (other than talking normal). Find a steep sloped bank near a channel swing and near some docks. Crappie are hanging out on docks early and late and it's an easy transition to your underwater light if you are near by. Drop your light before dark and wait about 1-2hrs. Shad will move in and swarm the light. Oh....... And find fish on the graph before sunset first before trying an area. :-) That's key. You can also move around and find docks with lights on them if the wife gets bored. Congrats on having a wife that said "yes" to new boat. Must be nice. LOL!
-
Does a slip bobber throw off the fish? How come you can't fish live bait down about 15-19ft just above them with a slip bobber at all hours during the day (provided the water is somewhat calm and not "wave-happy" from boat traffic.
-
LOL!!!!!
-
To quote Jim Carrey from the movie "Liar Liar".... "I HOLD MYSELF IN CONTEMPT!!" Lol! No, she was having a female moment. Not your fault by any means.
-
OK if I fished that area all day at variuos intervals and let them breath a little and came back every hour or so and fished it till my hands were border line bleeding..... Maybe 300. :-)
-
Maybe for some.....not for me. Unless I found a massive wad of fish and had side scan sonar, I'm thinking I could catch up to 50 on a great day. If conditions were just perfect, I was locked in on a bait color/size/depth and area was so thick with starving fish, I'd say I could get 100 between me and a co-angler. Not so convened of the 300 just yet. Lol!! Dynamite?? You betcha! Lol!


